Goose, the highly scalable load testing tool created by Tag1 Consulting, has undergone a number of improvements since its creation. Asynchronous support created a significant boost in performance, but Jeremy felt there was still room for improvement.
The blog post Cheap tricks for high-performance Rust contains multiple suggestions for compile-time optimization of Rust code. Based on the ideas in that post, Jeremy created an issue to try the various optimization techniques, and see what improvements came from them.
All Goose tests discussed here ran on a 1-core VM (virtual machine) against a 16-core VM hosting a Drupal website on Apache, Memcache, Varnish, and MySQL. All server-side processes are restarted before each type of test, then Goose runs for 10 minutes, sleeps for 30 seconds, runs again for 10 minutes, sleeps again for 30 seconds, and runs a third time for 10 minutes. The results are averaged together. In all cases Goose is configured to simulate 12 users, and is using 100% of the CPU resources allocated to the VM for the load test client.
Through experimentation we've found that 12 users is the "sweet spot" for using 100% of the CPU without choking the Goose process on this hardware and in this configuration; 10 users uses slightly less than 100%, etc.
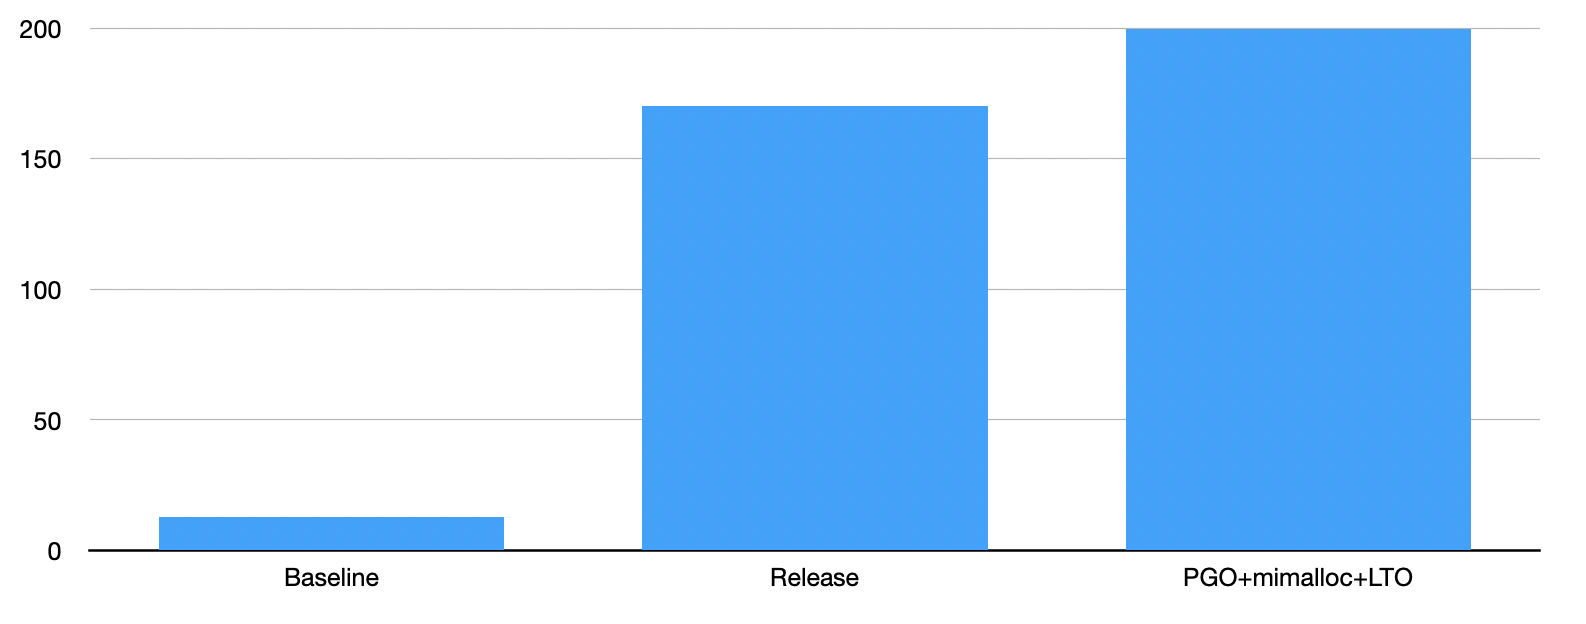
In and of itself, the amount of network traffic generated by the load test has no meaning, but it’s useful for comparing the difference between different compile time options. With no optimizations, the examples/drupal_loadtest load test generates ~13-14M in our testing environment.
The release flag
Adding the --release flag increases the network traffic to 170-180M. The load test is able to generate an average of 1,179% more requests. Static requests appear to inflate this comparison, but it remains an apples-to-apples comparison; each load test is identical, using the same configuration. To learn more about how this flag increases traffic so significantly, see Optimizations: the speed size tradeoff. Rust is designed to use this flag in real, production tests. All of the following optimizations are used in conjunction with the release flag.
The optimizations
As part of the ongoing work to improve Goose and increase efficiency and speed of testing, Jeremy tested these optimizations, singularly or in parallel, to determine what gave the biggest boost to performance, in megabytes of traffic generated.

Link time optimization
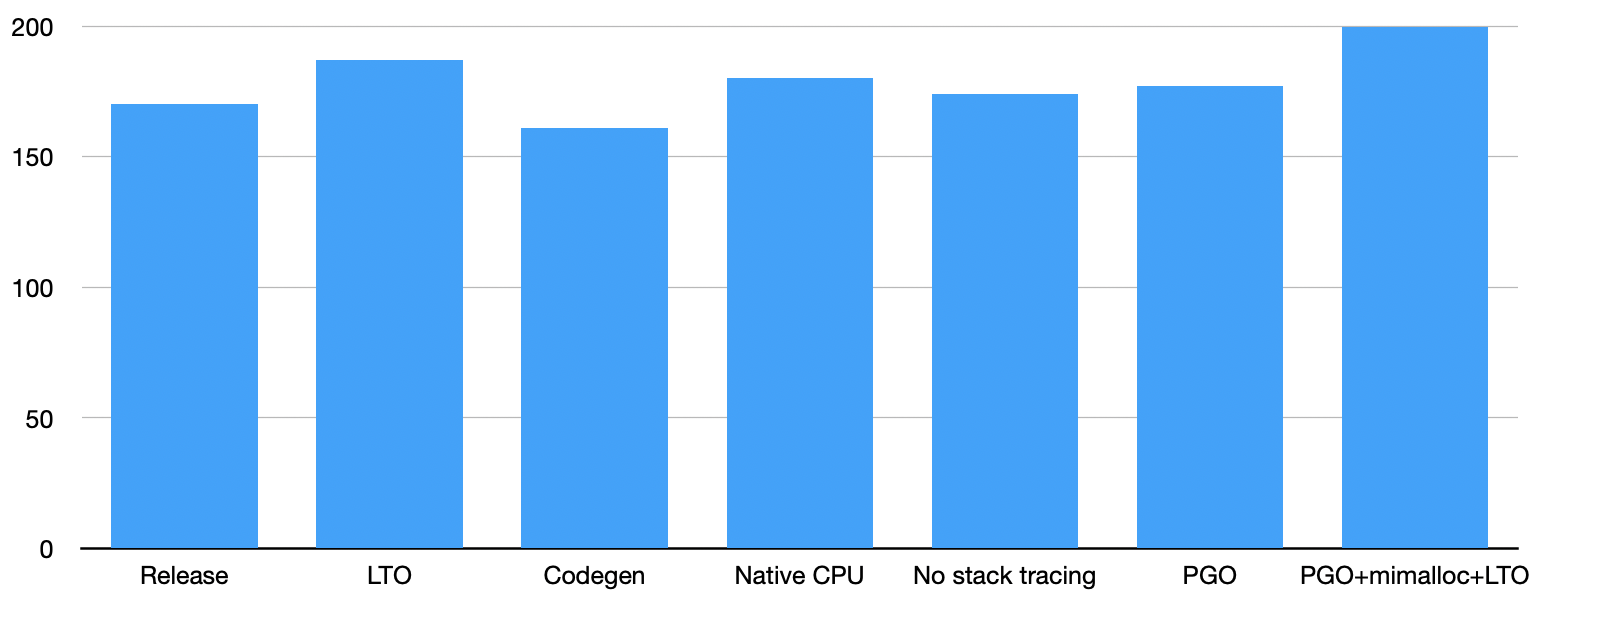
Adding Link Time Optimization (LTO) in conjunction with the --release flag increases the network traffic to 187M. The load test is able to generate an average of 8-10% more requests than with --release alone, or 1,309% more requests than the baseline. Given the boost over the initial baseline of the release flag alone, after this test it no longer made sense to compare to load tests run without --release.
Codegen units
Adding the codegen-units optimizations with link time optimization didn't show any improvement. This optimization was used to prevent the compiler from splitting the crate into multiple "code generation units" as is usually done to allow for faster parallel compilation. In this case, the slower compilation time also resulted in a slower load test, generating about .54% fewer requests compared to the previous optimizations, and didn't seem to improve Goose performance.
Even using this option alone (not combined with the LTO optimization), only saw a minimal ~1.5% improvement, not enough to consider it a measurable improvement over not using it.
Native CPU targets
By default, the Rust compiler tries to build "compatible" binaries that run on a large number of CPU-types. This optimization is intended to build a binary that only runs on one CPU-type: in this case, the AMD Ryzen Threadripper 2950 which we're currently leveraging for our tests.
Adding the native CPU target, which compiles the code to target a specific CPU type, to the LTO optimization with the --release flag again generated 180-187M traffic. The load test generated about 3% fewer requests compared to previous optimizations. This test result will quite likely vary when testing on other CPU types, depending on the specific optimizations available for those CPUs.
Remove stack tracing
Rust uses stack unwinding when a process panics. In the case of a load test, you can generally handle exceptions with Options and Results, and aren't likely to end up in situations where a thread needs to panic and unwind. Unwinding a panic has some overhead; disable this handling to remove the overhead.
Setting panic = "abort" with the --release flag only showed a ~2.5% improvement.
Using different allocators
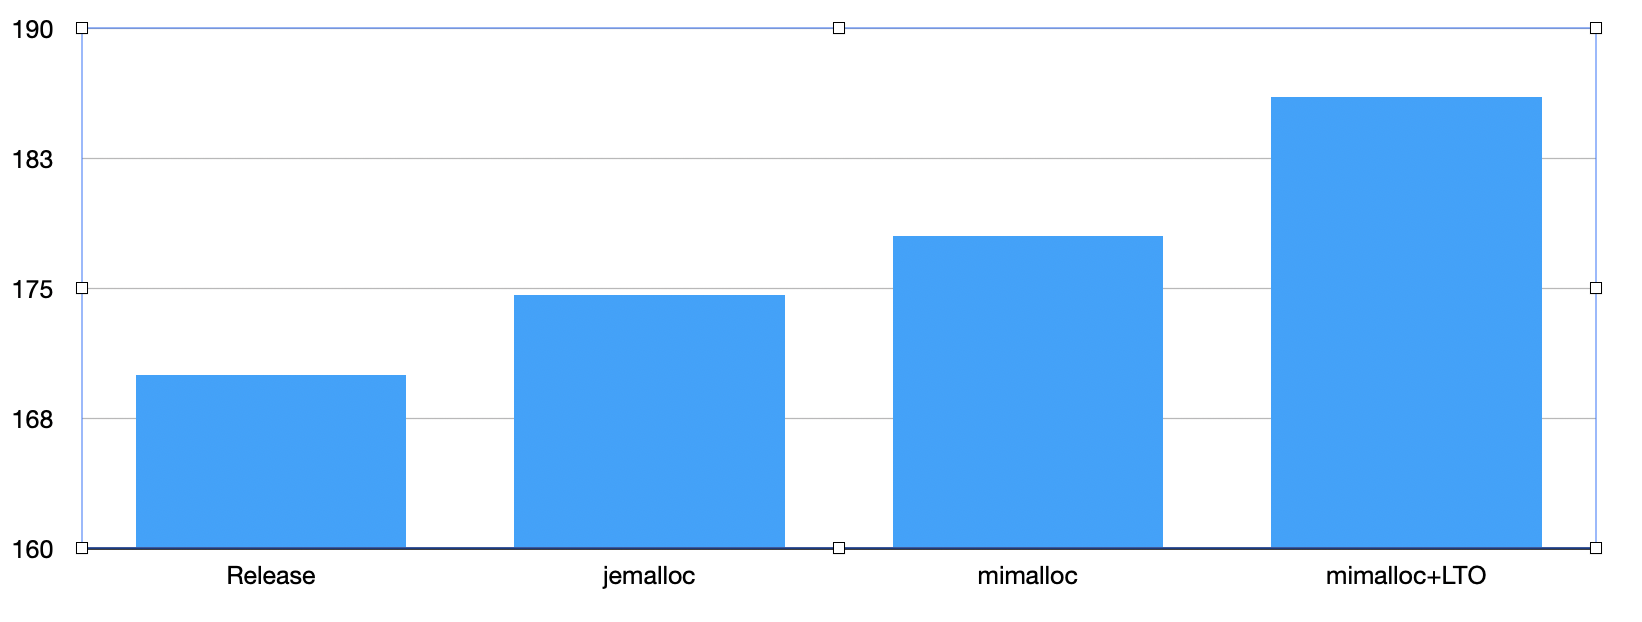
By default, Rust uses the memory allocator defined by the system. Other allocators may be better or more efficient for this use. Performing the same tests using the FreeBSD-inspired jemallacator as the global allocator offers a ~2.8% improvement, while using the Microsoft-maintained mimalloc as the global allocator offers a ~4.17% improvement. Combining mimalloc with the LTO optimization resulted in a ~9.5% total combined improvement over --release alone, in megabytes of traffic.

Profile guided optimization
Profile-guided optimization (PGO) involves collecting information about the typical execution of an instrumented version of a program, load tests in this case, and then creates an execution profile which can be fed back into the compiler which then optimizes how it compiles the program. It uses this information to choose the most efficient places to inline code, to intelligently select which registers are used, to generally streamline the generated machine code, and so on. We ran a single 10 minute load test with profiling enabled, and then fed the profiler information back to the compiler. Using this feature saw a ~4% improvement.
More impressive, when combining profile-guided optimization with mimalloc, the improvement increased to ~11%. Finally, combining it with both mimalloc and the previously discussed LTO optimization, we were able to achieve 200M of traffic! Metrics show a 20% improvement over just the --release flag, achieving our greatest optimization during these trials to see how compilation options alone can optimize the performance of our load tests
Summary and recommendations
When using Goose in production load tests, we have generally found it necessary to reduce the amount of load it generates, not increase it. Most websites simply can't handle the amount of load a Goose load test can generate without needing additional optimizations. Even when you do need to generate more load, in the vast majority of cases it's likely not worth the effort required to go through and test all of these optimizations. It would be far simpler to optimize by adding more CPU cores, a faster NIC, or spinning up a Gaggle and running a distributed load test from multiple servers.
In short, the release flag provides the largest optimization with the least amount of additional testing and is always recommended. No other single optimization produces increases in traffic like the release flag alone does. Using profile-guided and link time optimizations, along with using a specific memory allocator provided us with the most significant boost, but it's unlikely these optimizations will be worth the effort to configure and test when running your own load tests.

While we have found the options that work best with our load test on our hardware, there's no guarantee that using these options on a different load test will provide the same level of optimization. Any given server configuration may work better with some of these compile-time optimizations, and worse with others. We'd love to hear your experiences with optimizing your Goose load tests!
For more posts and talks Goose, see our index of Goose content.
Photo by Sharon McCutcheon on Unsplash

